choosing the time scale of a sensor record





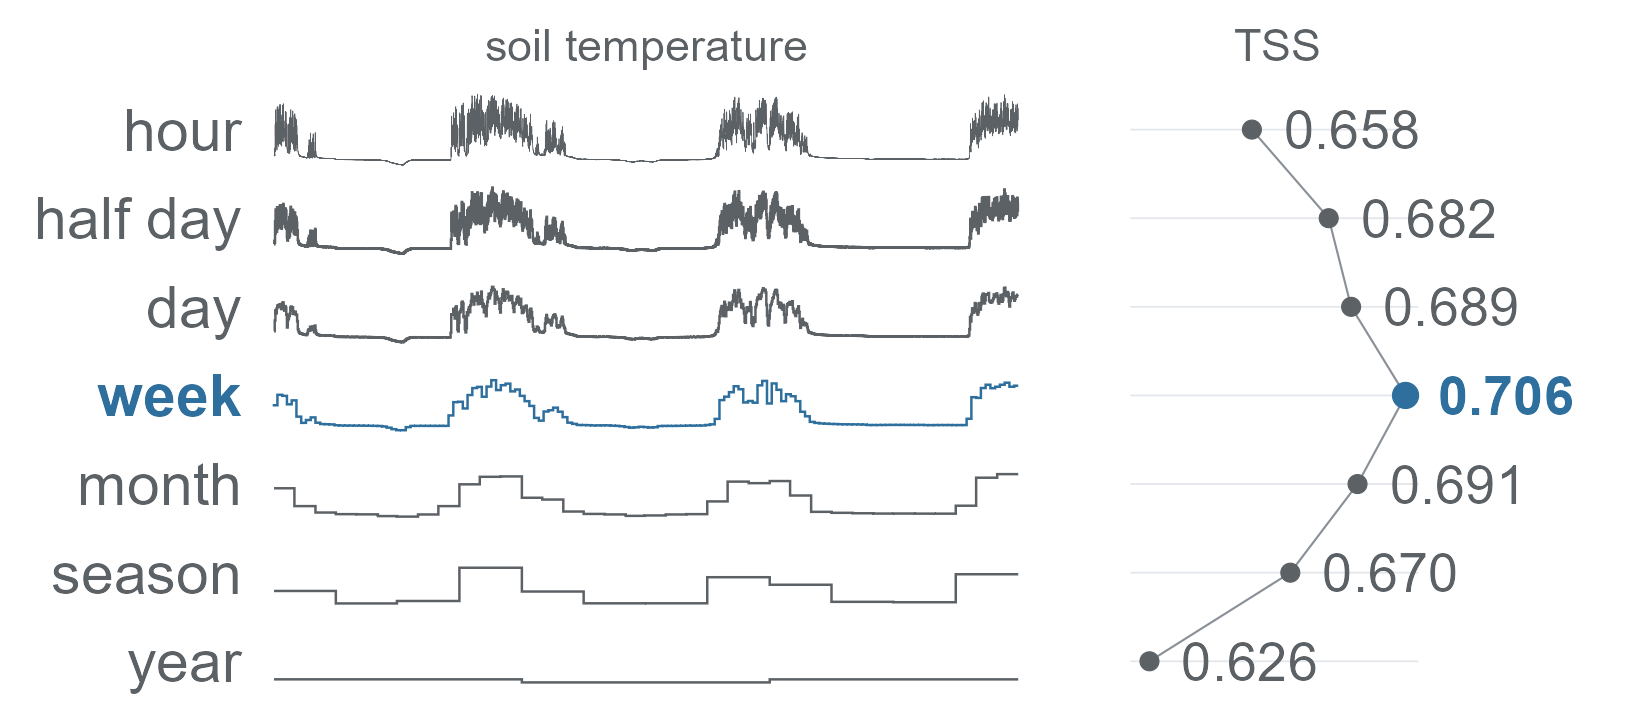
timesift compares time scales to find which gives the best predictions from a sensor record. For example, you can use three years of hourly soil temperature to predict which plant species grow at a plot, and compare models trained on daily, weekly or monthly summaries.
A grain is the time interval used to summarise the readings, such as a day, week or month. timesift groups readings into these calendar intervals and calculates a summary, such as the mean, for each one. It fits each model at each compatible grain and evaluates them on the same held-out observations. You can compare their predictions, select a grain using the training data, or combine predictions from several models in an ensemble.
timesift lets you:
lookback()
to summarise a period ending at each observation date.tss_inflation()
estimates this bias for your design, while implied_skill()
helps interpret the reported score.The model implementations are based on published methods and tested against reference packages including glmnet, MASS, rpart, earth, mda, mgcv, nnet, maxnet and biomod2. R and Python are tested against the same stored results, so they produce identical binned arrays. Cite the timesift version to identify the implementations and defaults used in an analysis.
timesift needs R 4.1 or later. The CRAN release installs from a binary on Windows and macOS and needs no build tools there:
install.packages("timesift")The development version compiles C++ code, so it needs a compiler:
| Operating system | Build tools |
|---|---|
| Windows | Rtools matching your R version |
| macOS | Run xcode-select --install in Terminal |
| Debian / Ubuntu | Install r-base-dev |
Check that R finds them:
pkgbuild::has_build_tools(debug = TRUE)Then install from GitHub:
# install.packages("pak")
pak::pak("gcol33/timesift")
The C++ code needs no system library: it uses only the C++ standard library, including its threads, and cpp11 headers at build time.
cnn(), rescnn() and mlp() run
on torch; every other learner
runs without it. torch is an R package plus the LibTorch library, which
it downloads once:
install.packages("torch")
torch::install_torch(timeout = 600)
Check that it loads, and whether it found a graphics processor:
torch::torch_is_installed()
torch::cuda_is_available()           # NVIDIA
torch::backends_mps_is_available()   # Apple Silicon
This installs the processor build on Windows and Linux and the Apple
Silicon build on macOS, where torch uses the graphics processor through
MPS. An NVIDIA graphics processor needs the CUDA build, set up in Installing
torch. train_control(device = "auto"), the default,
takes a graphics processor wherever torch finds one and the processor
otherwise.
The Python package has wheels for Linux, Windows and macOS and needs Python 3.11 or later:
pip install timesift

# with the torch encoders, the grain contrasts and the plots
pip install "timesift[torch,contrasts,plot]"
On Linux the torch this installs carries CUDA; on Windows it runs on the processor only, and the CUDA build comes from PyTorch’s own index, also in Installing torch. Check it with:
python -c "import torch; print(torch.cuda.is_available())"targets, with one row per sampling
unit and its responses, and series, with the time-stamped
readings for those units.timesift() with the response columns, the
identifier shared by both tables, the time column and the grains to
compare.predict() for new
sampling units.This example uses simulate_records() to generate a year
of readings from 150 sensors, sampled every three hours. The four
responses depend on seasonal values in the simulated record.
library(timesift)

sim <- simulate_records(n = 150, mechanism = "season", variables = 4,
                        prevalence = 0.3, auc = 0.9)
targets <- data.frame(unit = rownames(sim$y), sim$y)

fit <- timesift(targets, sim$readings, y = -unit, id = unit, time = time,
                sift = grains("day", "week", "month", "season"))
fit
#> timesift  150 targets, 4 responses, 10-fold random CV, roc_auc
#>
#> candidates, scored on the outer folds
#> candidate                     mean    won  responses
#> elasticnet / day             0.553      0  separate
#> elasticnet / season          0.571      0  separate
#> elasticnet / week            0.612      0  separate
#> elasticnet / month           0.712      4  separate
#>
#> procedure, chosen and weighted inside each outer training fold
#> selected                     0.712  se 0.077
#> ensemble                     0.712  se 0.077
#> selected elasticnet / month in 10 of 10 folds
#>
#> choice on every target  elasticnet / month
#> weights on every target  elasticnet / month 1.00
targets contains one 0/1 column per response and the
identifier, here unit; series contains that
identifier, a date-time column and the values, one row per reading.
y takes tidyselect expressions such as
starts_with("sp_"). A table with a missing reading in a bin
is refused, and coverage() shows which unit and bin lack
readings.
A candidate is a model fitted at one grain. The default
model is elasticnet(). The candidate rows show how each
pairing performed in cross-validation: each fold is held out in turn for
evaluation. Selecting the highest score from these rows uses the
evaluation data to choose a candidate.
Use the selected and ensemble rows to
report predictive performance. For these rows, candidate selection and
ensemble weighting happen within each training fold. The held-out fold
then evaluates the resulting predictions.
predict(fit, new_targets, new_series) summarises the new
readings at each required grain and predicts with the ensemble trained
on all targets. Use type = "binary" to convert predicted
probabilities to presence or absence. The threshold for each response is
estimated from out-of-fold predictions.
The same run in Python:
import timesift as ts

sim = ts.simulate_records(n=150, mechanism="season", variables=4,
                          prevalence=0.3, auc=0.9)
targets = {"unit": sim.y.units}
targets.update(zip(sim.y.variables, sim.y.values.T))

fit = ts.timesift(targets, sim.readings, y=list(sim.y.variables),
                  id="unit", time="time",
                  sift=ts.grains("day", "week", "month", "season"))
print(fit)grains("day", "week", "month") names a set of grains to
compare, and grains("auto") takes every named grain that
gives the record at least two bins. A learner runs across the whole set,
or at one grain when it is given one, as in
cnn(data = grain("week")).
Bins follow the calendar: months have 28 to 31 days, and weeks start
on Monday. year_start sets the start of the year, for
example for a hydrological year. You can define a custom calendar with a
function of the reading times, such as seasons beginning at the
equinoxes.
min and max give the lowest and highest
individual reading in each bin. cold_day and
warm_day first calculate daily means, then return the
lowest and highest daily mean within the bin.
grain_matrix() and lookback_matrix() return
the binned arrays, [unit, bin, channel], without fitting
anything. Representing
a record covers every grain and statistic.
grain_ladder() fits one learner at every grain and shows
where skill levels off. grain_contrasts() compares every
grain with a learner’s best one, and paired_contrast()
compares two candidates on matched cells. select_grain()
chooses the grain inside the training data and scores the whole
procedure. Finding
the grain runs them on a record with a known answer.
ensemble() stacks the candidates with non-negative
weights summing to one, fitted on their out-of-fold predictions alone.
project() maps a fit onto rasters and
range_change() compares two projections. Ensembles,
thresholds and maps goes from a scored run to maps.
The true skill statistic (TSS) is overestimated when the threshold is chosen to maximise TSS on the same held-out observations used to report the score. The fewer presences there are in the held-out data, the more TSS tends to overestimate population skill. For the sampling design of the Schrankogel study, a record of hourly soil temperature from alpine plots, the estimated inflation is 0.110 on average when the true skill is 0.60.
tss_inflation() estimates the TSS that a given sampling
design would report for a known population skill.
implied_skill() reverses this calculation: given a reported
TSS, it estimates the population skill that would yield that score on
average under the same sampling design and assumed prediction
distribution. This simulation-based matching follows the principle of
indirect inference (Gouriéroux
et al., 1993). By default, runs are scored by the area under the
receiver operating characteristic curve (AUC), with TSS also reported.
Scores,
thresholds and their inflation works through both functions.
Start with Choosing how a record is read: one path from two tables to a scored comparison and predictions. Every code block has an R and a Python version, and the Python view of Get started opens with Python selected.
Questions and bug reports go to the GitHub issues. A bug report is easiest to act on with a small reproducible example, for instance made with reprex.
Building from a checkout, the test suites and the rules for the shared fixtures are in CONTRIBUTING.md.
“Software is like sex: it’s better when it’s free.” — Linus Torvalds
I’m a PhD student who builds R packages in my free time because I believe good tools should be free and open. I started these projects for my own work and figured others might find them useful too.
If this package saved you some time, buying me a coffee is a nice way to say thanks. It helps with my coffee addiction.
timesift is licensed under MIT.
To cite timesift in publications use:
Colling G (2026). _timesift: Learn Predictive Representations of
Time-Varying Data_. doi:10.32614/CRAN.package.timesift
<https://doi.org/10.32614/CRAN.package.timesift>. R package version
0.6.1, <https://gillescolling.com/timesift/>.
BibTeX:
@Manual{colling2026timesift,
  title = {timesift: Learn Predictive Representations of Time-Varying Data},
  author = {Gilles Colling},
  year = {2026},
  note = {R package version 0.6.1},
  doi = {10.32614/CRAN.package.timesift},
  url = {https://gillescolling.com/timesift/},
}