


# Install the release from CRAN:
install.packages("NACHO")

# Or install the development version from R-universe:
install.packages(
  "NACHO",
  repos = c("https://mcanouil.r-universe.dev", "https://cloud.r-project.org")
)

# Or install the latest commit from GitHub with pak:
# install.packages("pak")
pak::pak("mcanouil/NACHO")The package ships six samples of the public study GSE178516, so this
runs offline. load_rcc() reads the RCC files, computes the
quality-control metrics and normalises the counts.
library(NACHO)

data_directory <- system.file("extdata", "GSE178516", package = "NACHO")
nacho <- load_rcc(
  data_directory = data_directory,
  ssheet_csv = file.path(data_directory, "samplesheet.csv"),
  id_colname = "IDFILE",
  instrument = "max",
  n_comp = 5
)
#> ℹ Reading 6 RCC files
#> ✔ Reading 6 RCC files [25ms]
#>
#> ℹ Assembling 6 samples
#> ✔ Assembling 6 samples [18ms]
#>
#> ℹ Computing quality-control metrics and normalising
#> ✔ Computing quality-control metrics and normalising [24ms]
#>
nacho_qc(nacho)[, c("IDFILE", "status", "n_flags", "reason")]
#>                  IDFILE status n_flags reason
#> 1 GSM5393247_S02.RCC.gz   pass       0   <NA>
#> 2 GSM5393248_S13.RCC.gz   pass       0   <NA>
#> 3 GSM5393250_S15.RCC.gz   pass       0   <NA>
#> 4 GSM5393251_S16.RCC.gz   pass       0   <NA>
#> 5 GSM5393267_S46.RCC.gz   pass       0   <NA>
#> 6 GSM5393268_S47.RCC.gz   pass       0   <NA>
autoplot() draws any quality-control figure,
render() writes a report with Quarto, and
visualise() opens the app.
autoplot(nacho, type = "BD")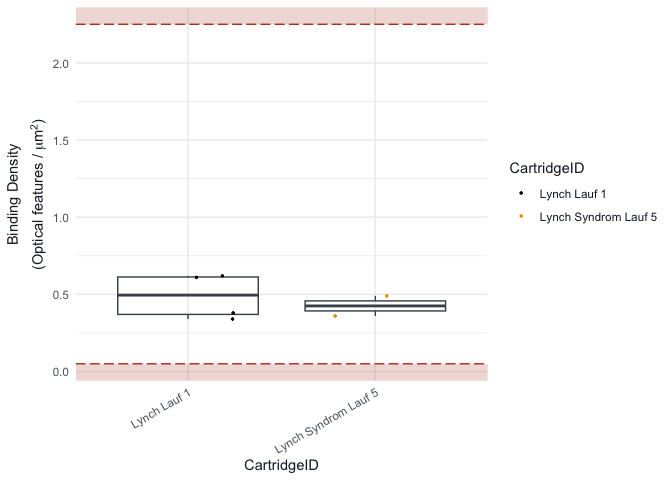
render(nacho, output_dir = tempdir())
visualise(nacho)NACHO works with NanoString nCounter data. It reads the RCC files, flags the samples that fail quality control and normalises the counts.
load_rcc() reads the RCC files and a sample sheet,
computes the quality-control metrics and normalises the counts.visualise() opens a Shiny app to look at every metric
and change the limits.autoplot() draws any quality-control figure as a
ggplot2 plot.render() writes a quality-control report with Quarto,
as an HTML or a PDF file.normalise() runs the normalisation again with new
settings.The package website shows the app, the report and a full analysis.
Open the app on a nacho object with
visualise().
visualise(GSE74821)
The articles “Explore quality control in the app” and “Analyse a GEO study” on the package website show each page of the app and a full analysis of GSE178516. The article “Moving from NACHO 2” on the same website maps the NACHO 2 code to NACHO 3.
Canouil, M., Bouland, G. A., Bonnefond, A., Froguel, P., ’t Hart, L. M., & Slieker, R. C. (2020). “NACHO: an R package for quality control of NanoString nCounter data”. Bioinformatics, 36(3), 970-971. doi: 10.1093/bioinformatics/btz647
@Article{Canouil2020,
  title = {{NACHO}: an {R} package for quality control of {NanoString} {nCounter} data},
  author = {Mickaël Canouil and Gerard A. Bouland and Amélie Bonnefond and Philippe Froguel and Leen M. {'t Hart} and Roderick C. Slieker},
  journal = {Bioinformatics},
  year = {2020},
  month = {feb},
  volume = {36},
  number = {3},
  pages = {970--971},
  issn = {1367-4803},
  doi = {10.1093/bioinformatics/btz647},
}If you encounter a clear bug, please file a minimal reproducible
example on GitHub.
For questions and other discussion, please contact the package
maintainer.
Please note that this project is released with a Contributor
Code of Conduct.
By contributing to this project, you agree to abide by its terms.